
Build a BigQuery + dbt + Looker portfolio project.
25 guided steps. A public GitHub repository. A production-shaped dbt project with snapshots, incremental marts, and CI. Scheduled jobs running in dbt Cloud across Dev and Prod. A Looker Studio dashboard you can put in front of a stakeholder — or a hiring manager — and walk through.
Sample marketing-attribution dataset · revenue figures illustrative
Three artifacts. One coherent project.
The capstone produces three connected artifacts: a GitHub repository, a configured dbt Cloud project, and a stakeholder-facing dashboard.
A public GitHub repo
Sources, staging, intermediate, marts, snapshots, tests, macros, docs. Five logical commit groups, a README a hiring manager can skim in 90 seconds.
A dbt Cloud project
Connected to BigQuery, deployed across Dev and Prod environments, with Daily Incremental and Weekly Full Refresh jobs on a schedule.
A Looker Studio dashboard
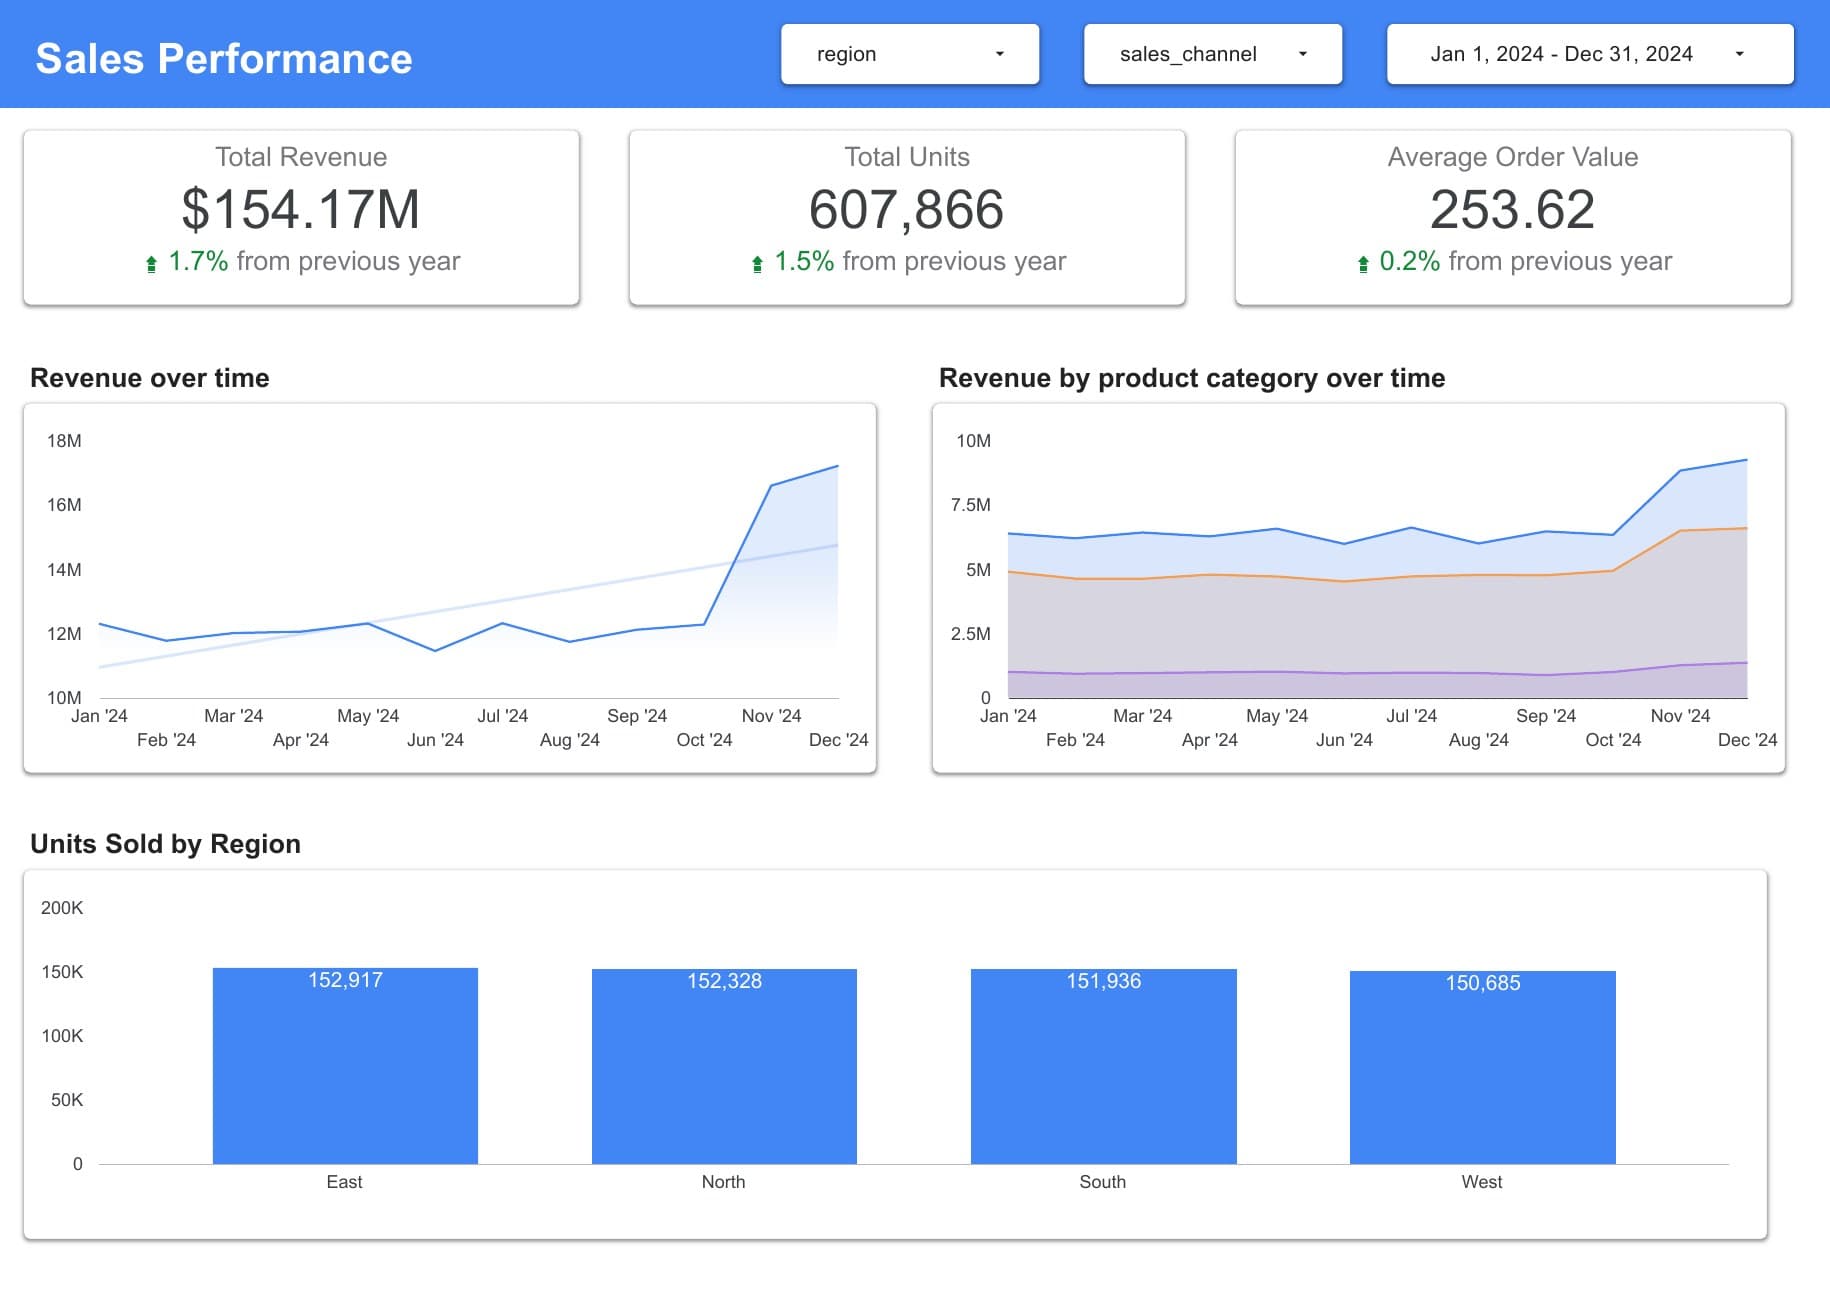
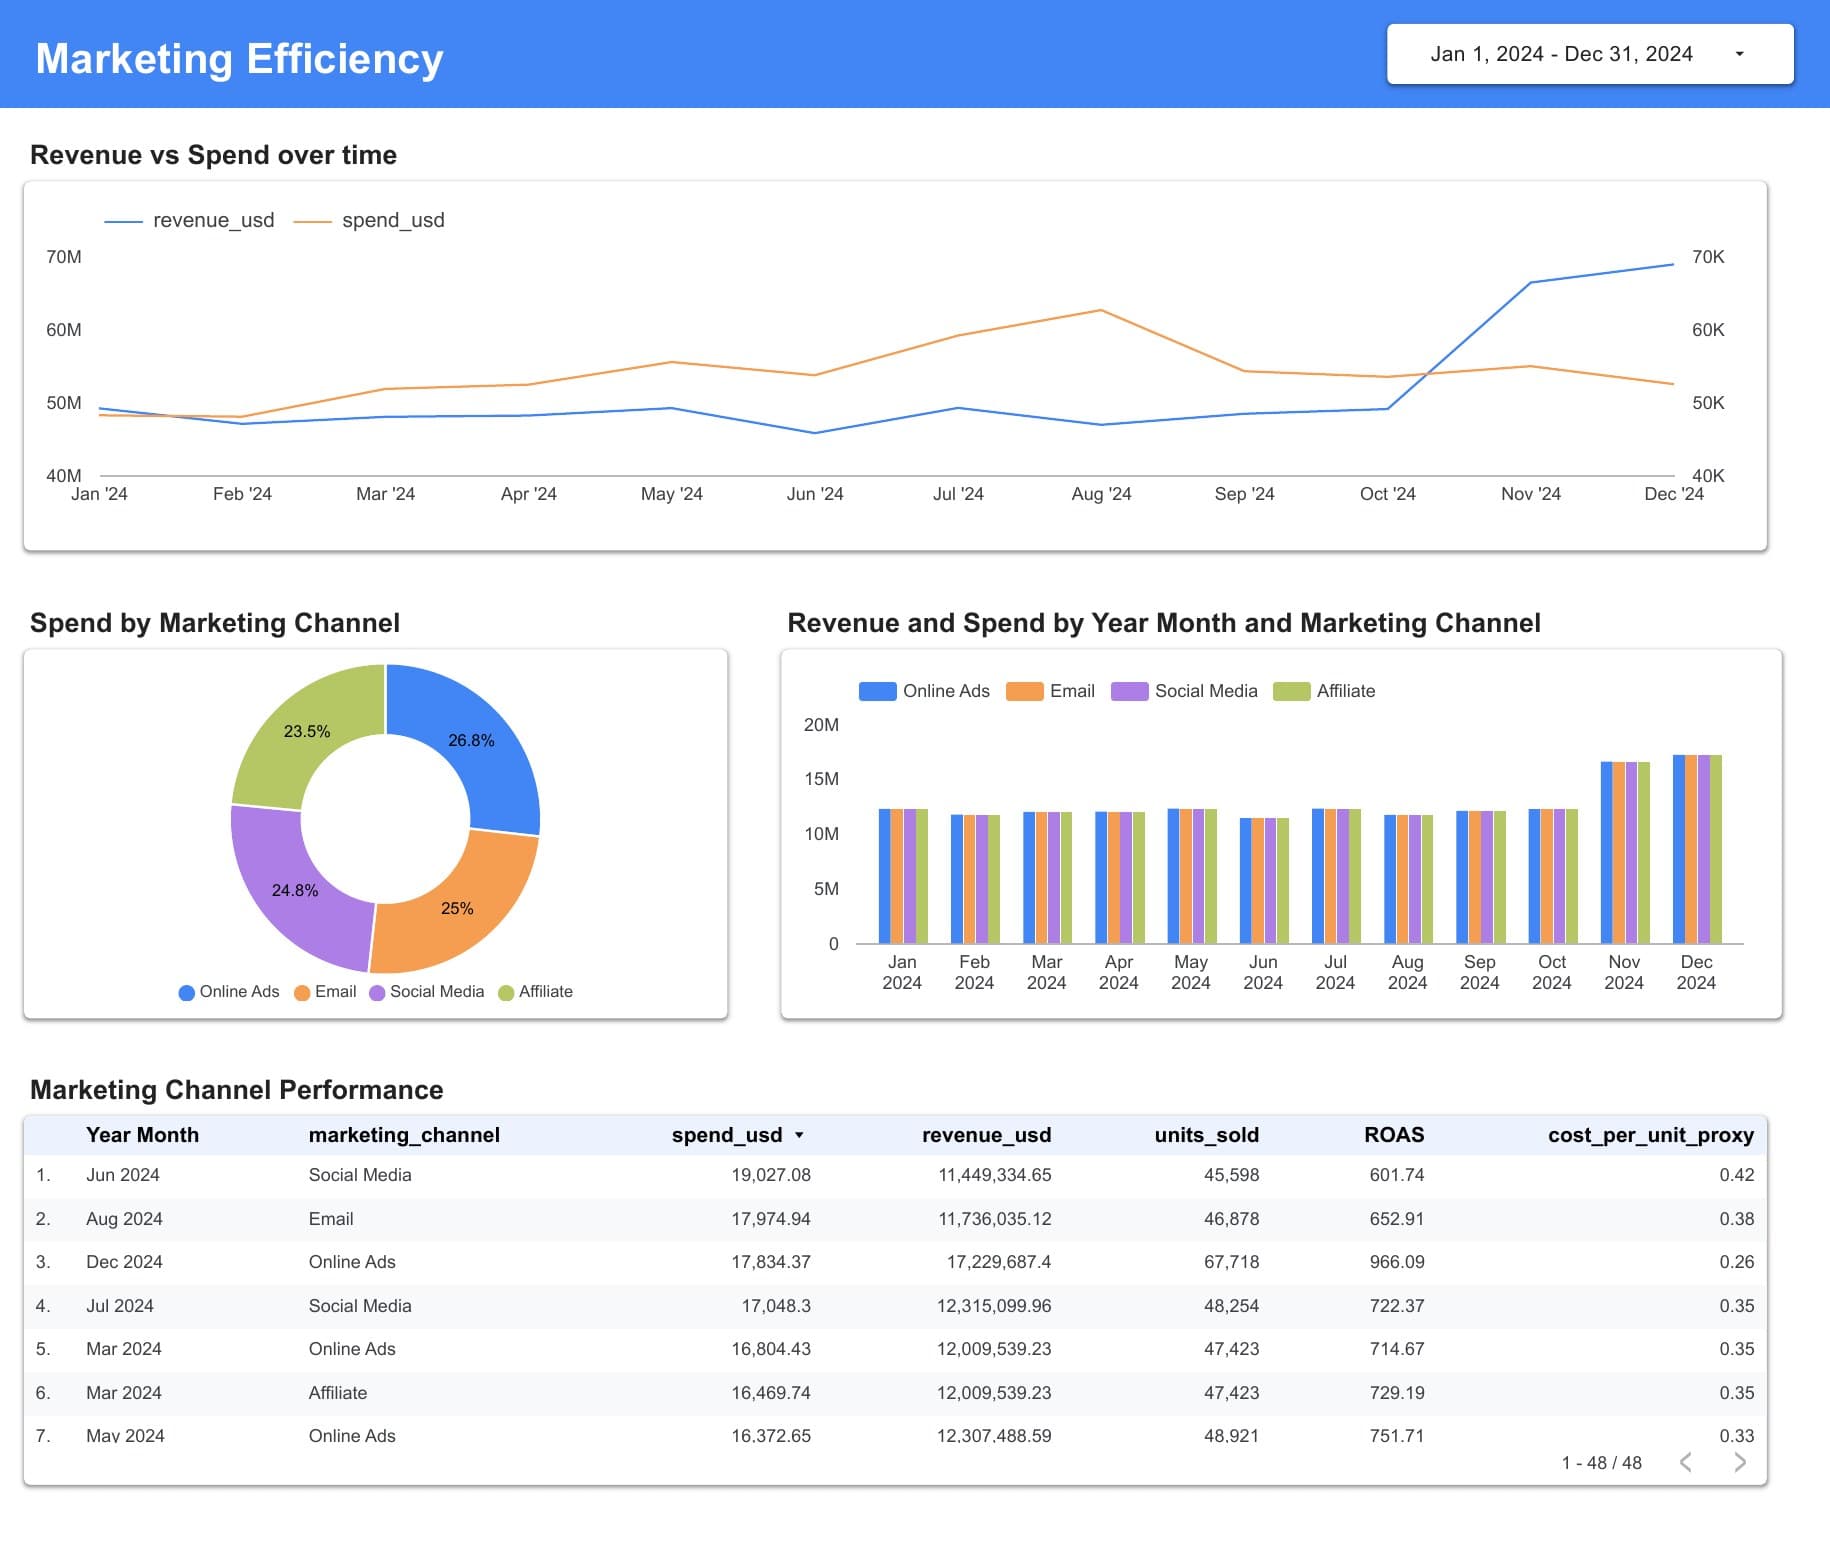
Two pages — Sales Performance and Marketing Efficiency — built directly on the dbt marts. The metric layer is defined in dbt, not in the BI tool.
The dashboard you walk a stakeholder through.
Two pages, built directly on dbt marts in BigQuery. No raw-table joins in Looker; the metric layer is engineered, documented, and tested upstream.
A layered dbt project with tests, snapshots, and marts.
Build the models through 25 guided steps, then submit the finished repository and dashboard for written human review.
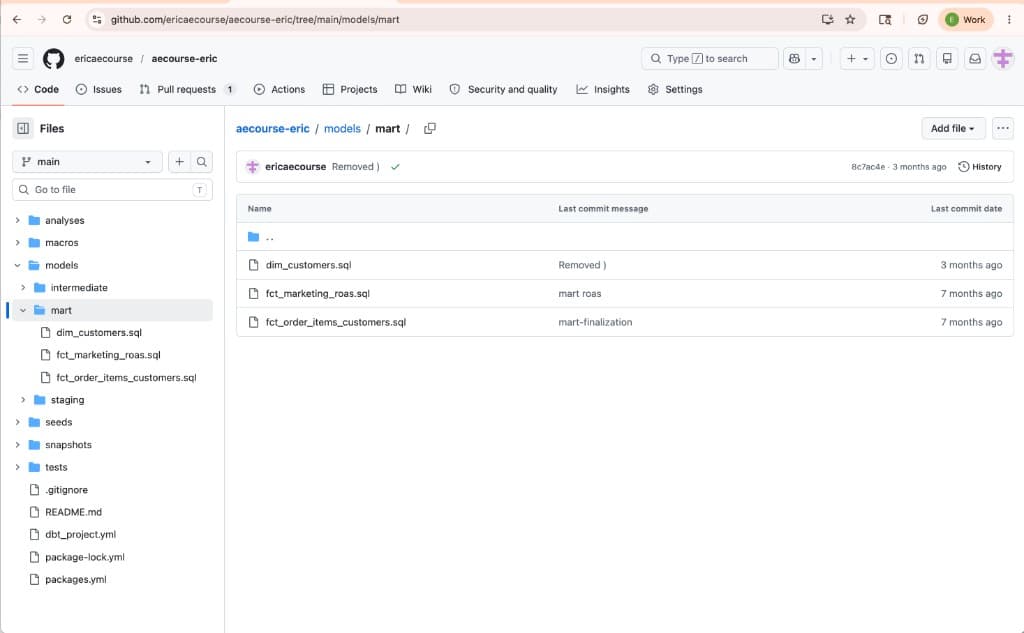
Three mart-layer models — a customer dimension built off SCD2 snapshots, a marketing-ROAS fact, and an order-item-grain customer fact. Each one references upstream staging and intermediate models with ref().
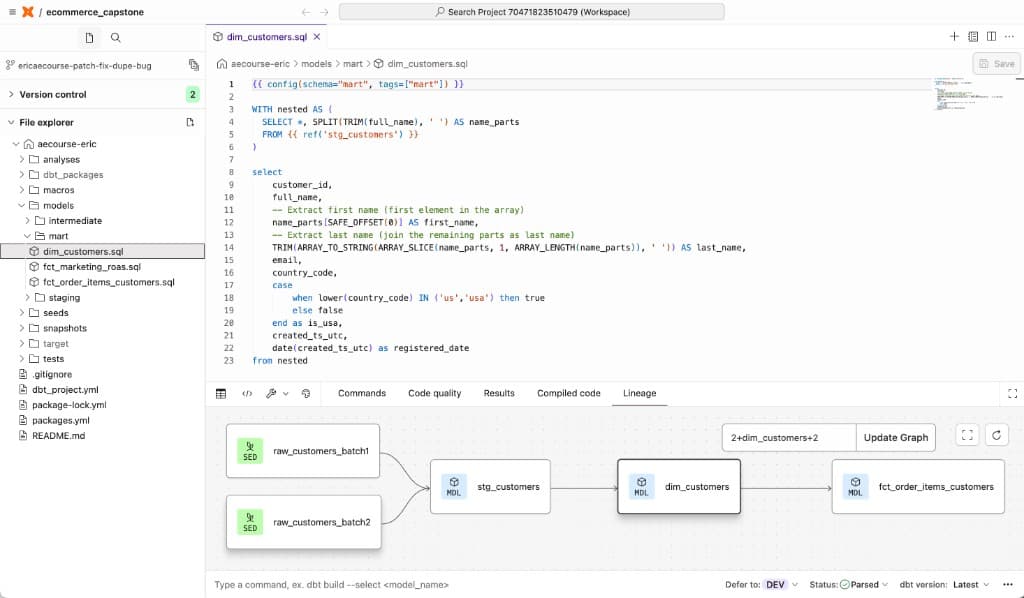
Two raw customer seeds feed a staging model, which feeds the dimension, which feeds a downstream fact. The DAG is visible, versioned, and reviewable, so a reviewer can trace each mart to its sources.
Scheduled jobs, Dev and Prod, the whole posture.
The capstone includes scheduled deployment, separate development and production environments, and run monitoring.
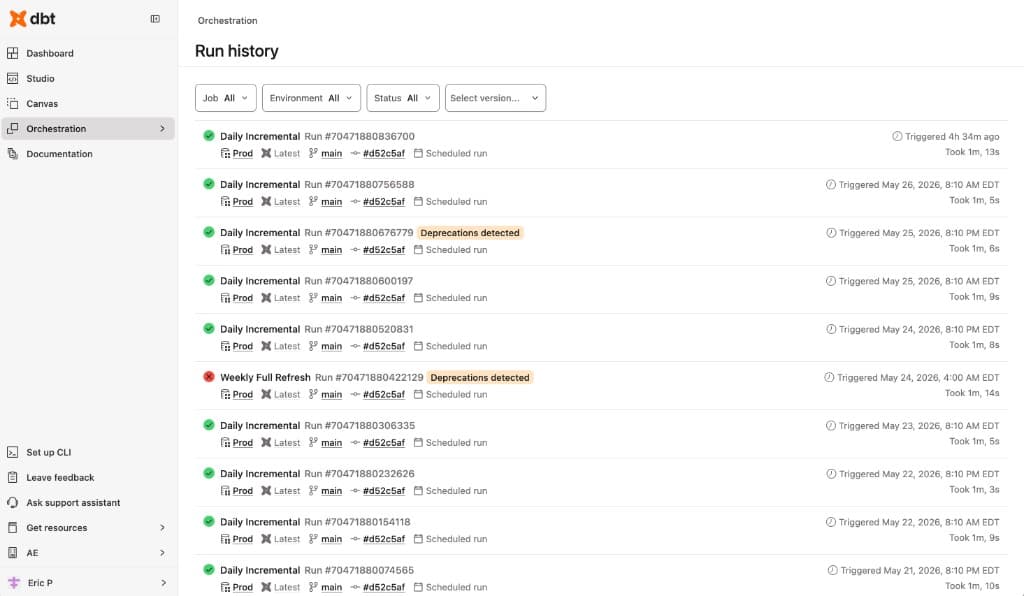
Daily Incremental jobs run on a schedule against Prod. A Weekly Full Refresh keeps the snapshots honest. Failures and deprecation warnings are surfaced where an on-call engineer actually looks — not buried in logs.
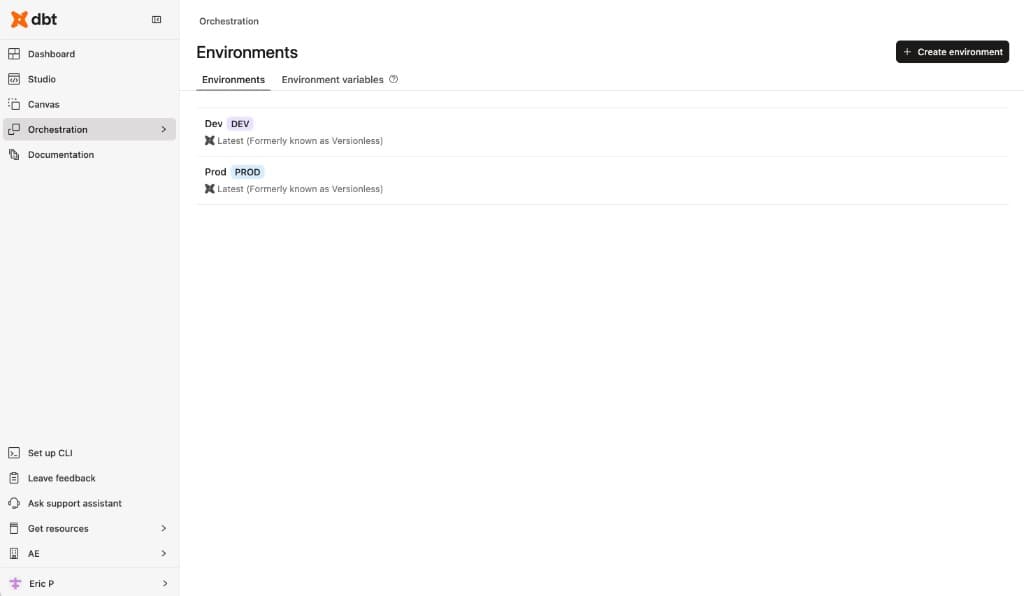
The example uses different schemas, credentials, and schedules for development and production.
Twenty-five guided steps, from empty repo to deployed dashboard.
Each step is a short video walkthrough with the code you write in the dbt Cloud IDE. Built to be done over two or three weekends, or stretched across a month.
- 01
Capstone Intro
Walkthrough of the brief, the deliberately messy source data, and the final deliverable — and why your first job is to clean it to a defined grain.
Free preview - 02
Google Account Creation
Spin up a Google Cloud account; understand the billing posture.
Course - 03
GitHub Repo Creation
Initialize a public repo for the project; set the README scaffold.
Course - 04
BigQuery + Service Account
Create the project, dataset, and a service account for dbt Cloud.
Course - 05
dbt Cloud Initial Setup
Connect dbt Cloud to BigQuery; configure the warehouse adapter.
Course - 06
dbt Cloud GitHub Connection
Wire dbt Cloud to the GitHub repo for IDE + scheduled jobs.
Course - 07
dbt Project Initialization
First commit; `dbt_project.yml` configured for staging / intermediate / mart layers.
Course - 08
dbt Project + packages.yml
Add packages.yml; install dbt_utils and other ecosystem packages.
Course - 09
dbt Seed Files (pt 1 + pt 2)
Load the source CSVs as seeds; document each one in schema YAML.
Course - 10
dbt Macros
First macro: a reusable helper; understand when macros belong in models vs analyses.
Course - 11
Staging Orders / Order Items / Customers / Adspend
One staging model per source table — clean column names, types, and units, and de-duplicate each source to its intended grain (latest order per order_id, one spend row per date/channel/campaign).
Course - 12
dbt Snapshots (SCD2)
Snapshot customers as a Type 2 slowly-changing dimension.
Course - 13
Intermediate Order Items Enriched
Join staging tables into a denormalized intermediate model.
Course - 14
Intermediate ROAS
Aggregate ad spend to one row per date/channel/campaign first, then join to revenue — so the ROAS numbers don't fan out and overstate cost.
Course - 15
Mart ROAS
Final ROAS mart — the table that powers the marketing dashboard.
Course - 16
Mart Order Item Customers
Order-item-grain fact — one row per (order_id, product_sku) — enriched with customer attributes, order totals, and latest order date.
Course - 17
Dim Customers
Customer dimension with SCD2 fields exposed to BI.
Course - 18
dbt Incremental
Convert one mart to incremental materialization; understand the trade-offs.
Course - 19
dbt Tests
Generic + singular tests on PKs, FKs, accepted values, and business rules — including uniqueness tests on each model's grain that fail loudly if the source duplicates slip through.
Course - 20
dbt Orchestration
Schedule Daily Incremental + Weekly Full Refresh jobs in dbt Cloud.
Course - 21
md Files + Advanced Configurations
doc blocks, README polish, and a `dbt docs generate` site.
Course - 22
Looker + Capstone Closing
Connect Looker Studio to BigQuery; build the two-page dashboard.
Course
What this project proves you can do.
- End-to-end ownership of a data product — from raw CSVs to a stakeholder-facing dashboard.
- Cleaning documented source data with deliberate quality issues — deduping to a defined grain so marts don't fan out.
- Production dbt patterns: staging → intermediate → mart layering, snapshots, incremental models, tests.
- Cloud warehouse work on BigQuery with dbt Cloud.
- dbt Cloud orchestration with separate Dev and Prod environments and scheduled jobs.
- Git hygiene: branches, PRs, a clear commit history, and a documented README.
- BI fluency: Looker Studio connected to the marts, with the metric layer designed in dbt.
Build it.
The capstone ships with Analytics Engineering Mastery. One payment, lifetime access, every future update included. 7-day refund if it isn't for you.