
Fact Table vs Dimension Table: Differences, Grain, and Examples
Explore the roles of fact and dimension tables in data warehousing. Learn how they work together to enhance data analysis and business insights.
On this page · 25 sections
- Fact table vs dimension table at a glance
- Three kinds of fact table
- Worked example: a retail star schema
- Declare the grain before choosing columns
- Key Takeaways
- Understanding Fact and Dimension Tables
- Definition of Fact Tables
- Definition of Dimension Tables
- The Relationship Between Facts and Dimensions
- Design Principles and Best Practices
- Choosing the Right Grain
- Handling Keys and Relationships
- Avoiding Data Redundancy
- Practical Applications and Examples
- Common Fact Table Metrics
- Dimension Table Examples
- Impact on Query Performance and Analysis
- Frequently Asked Questions
- What is the difference between fact and dimension tables?
- Can you provide an example of both fact and dimension tables?
- How do fact and dimension tables interact within a data warehouse?
- What are the characteristics of a fact table in comparison to a dimension table?
- How are keys used in fact tables and dimension tables?
- What are the different types of fact tables commonly used in BI?
- Primary sources and further reading
- Topic
- Data Modeling
- Category
- Data Modeling
- Reading path
- Then: Build an ecommerce dimensional model
Quick answer: a fact table stores measurable events, such as orders, payments, or page views, with one row per event at a declared grain, plus numeric measures and foreign keys. A dimension table stores the descriptive context for those events, such as customer, product, store, and date, with one row per member and many text attributes. Facts are long and narrow and grow continuously; dimensions are wide, shorter, and change slowly. You filter and group by dimension columns and sum or count fact columns.
Fact table vs dimension table at a glance
| Aspect | Fact table | Dimension table |
|---|---|---|
| One row represents | An event or measurement at a declared grain (one order line) | One member of a business entity (one customer) |
| Typical columns | Foreign keys, numeric measures, degenerate IDs | Surrogate key, natural key, descriptive attributes |
| Shape | Many rows, few columns | Fewer rows, many columns |
| Growth | Appends continuously | Changes slowly (see SCD types) |
| In queries | Summed, counted, averaged | Filtered, grouped, labeled |
| Examples | fct_orders, fct_payments, fct_sessions | dim_customer, dim_product, dim_date |
Three kinds of fact table
- Transaction facts record one row per event, such as an order line or a click.
- Periodic snapshot facts record a state at regular intervals, such as an account balance per month.
- Accumulating snapshot facts track a process through milestones, such as order placed, shipped, and delivered, updating one row as it moves.
Worked example: a retail star schema
Grain: one row per order line. The fact table holds keys and measures; each dimension holds the context.
fct_order_lines   order_line_id, order_id, date_key, customer_key, product_key, quantity, net_amount
dim_customer      customer_key, customer_id, name, segment, country
dim_product       product_key, sku, product_name, category, brand
dim_date          date_key, date_day, week, month, quarter, year
Revenue by category and month then reads naturally: group by dimension attributes, sum the fact measure.
SELECT
  d.month,
  p.category,
  SUM(f.net_amount) AS revenue
FROM fct_order_lines AS f
JOIN dim_date AS d ON f.date_key = d.date_key
JOIN dim_product AS p ON f.product_key = p.product_key
GROUP BY d.month, p.category;
Declare the grain before choosing columns
The most important sentence in a dimensional model is “one row represents …”. Write it before designing keys or measures. If the grain is one order line, quantity and extended amount belong on that row; an order-level shipping total does not unless you allocate it deliberately. Mixing grains creates totals that look plausible and are wrong.
- Choose the business process and declare its lowest useful grain.
- List the dimensions available at that exact event or snapshot.
- Add numeric facts that are true at the grain and document whether they are additive.
- Choose surrogate or natural keys deliberately.
- Decide whether changing dimension attributes need SCD history.
Facts are not always transactions. Periodic snapshots capture a regular state, such as account balance by month; accumulating snapshots track a process that moves through milestones. Keep those patterns in separate tables unless one grain can state the meaning of every row without exceptions. Then connect the model to the broader warehouse schema design.
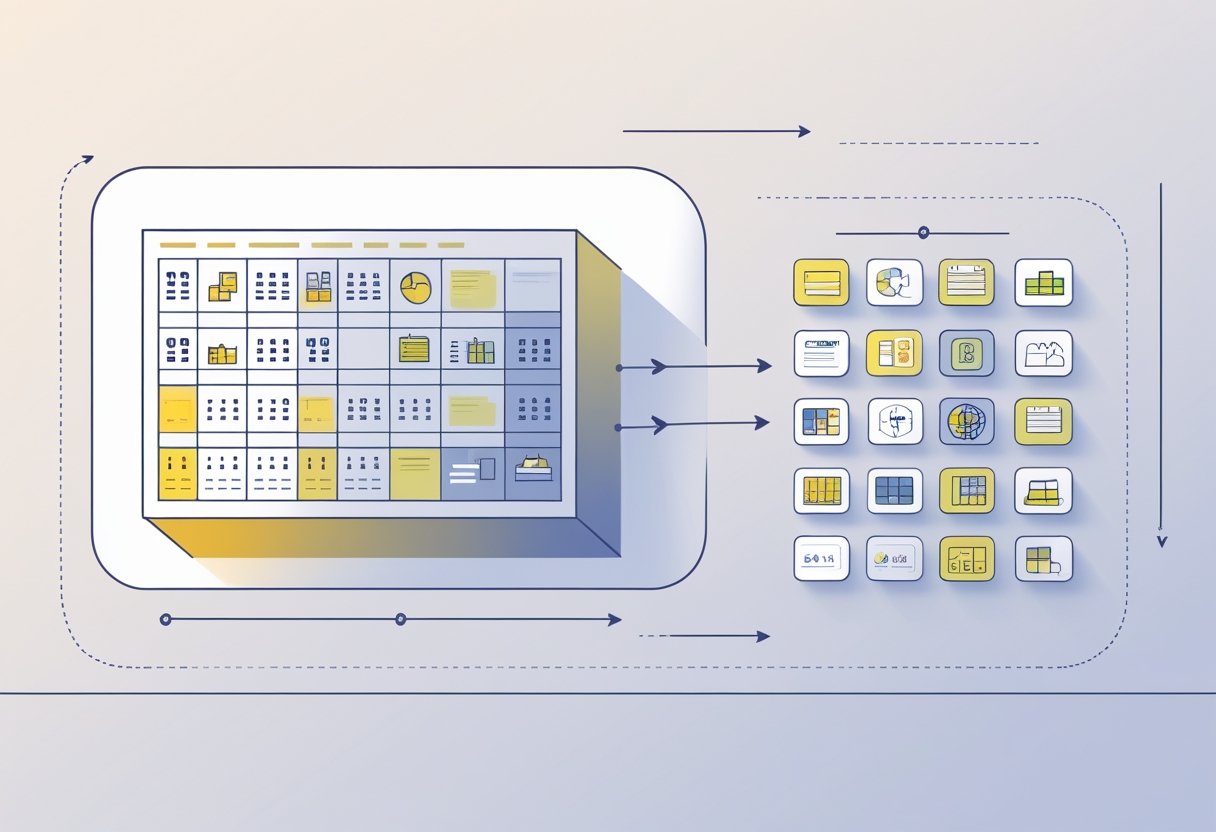
Think of shopping at a store. The receipt shows you bought 3 items for $25 on January 15th. The numbers (3 items, $25) would go in a fact table. The details about what you bought, when you bought it, and where you shopped would go in dimension tables. Understanding fact and dimension tables helps you organize data so computers can quickly answer business questions.
Learning how these tables work together will help you build better reports and make smarter business decisions. You'll discover how to design them correctly, avoid common mistakes, and see real examples from different industries.
Key Takeaways
- Fact tables contain measurable numbers while dimension tables store descriptive information that gives context to those numbers
- These tables work together in star and snowflake patterns to organize data for fast business analysis
- Proper design using best practices ensures your data warehouse performs well and answers business questions accurately
Understanding Fact and Dimension Tables
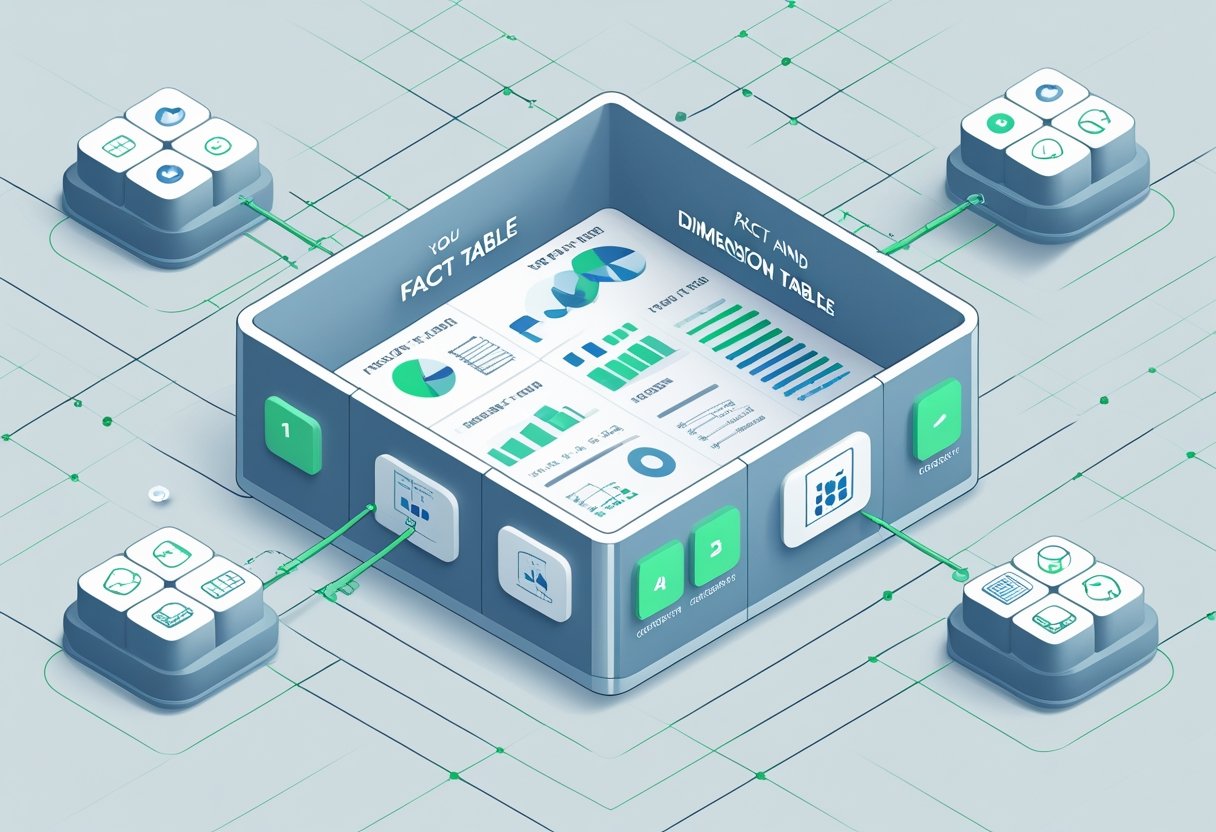
Fact tables store numerical measurements and business metrics, while dimension tables contain descriptive information that provides context for those numbers. These two table types work together through relationships that enable meaningful data analysis in warehouses.
Definition of Fact Tables
Fact tables serve as the central storage location for quantitative data in a data warehouse. They contain numerical measurements called facts or measures that businesses want to analyze.
Sales revenue, transaction counts, and profit margins represent typical examples of facts. Each record in a fact table captures a specific business event or measurement at a particular point in time.
Fact tables maintain a compact structure focused on efficiency. They store primarily numerical data and foreign keys that connect to dimension tables.
The design prioritizes fast aggregation and mathematical operations. Fact tables focus on capturing quantitative metrics rather than descriptive details.
Most fact tables contain millions or billions of records. This large volume requires careful optimization for query performance and storage efficiency.
Definition of Dimension Tables
Dimension tables provide descriptive context for the numerical data stored in fact tables. They contain attributes that help users understand what the numbers mean and how to categorize them.
Customer names, product categories, and geographic regions are common dimension attributes. Dimension tables provide descriptive, categorical context that makes raw numbers meaningful.
These tables typically have fewer records than fact tables but contain more columns. Each record represents a unique entity like a specific customer, product, or time period.
Dimension tables support filtering and grouping operations in queries. Users can slice data by different attributes to create reports and analyze trends.
The structure emphasizes readability over storage efficiency. Dimension tables often contain redundant information to make queries simpler and faster.
The Relationship Between Facts and Dimensions
Facts and dimensions connect through foreign key relationships that enable comprehensive data analysis. Through foreign keys, fact tables connect with dimension tables for more detailed insights.
Each fact table record contains foreign keys pointing to related dimension table records. This creates a web of relationships that supports complex analytical queries.
Star schema represents the most common design pattern. The fact table sits at the center with dimension tables radiating outward like points of a star.
Users can combine facts with any dimension attributes during analysis. A sales fact might connect to customer, product, and time dimensions simultaneously.
This relationship structure enables drill-down analysis and multi-dimensional reporting. Businesses can examine the same facts from multiple perspectives by joining different dimension tables.
Design Principles and Best Practices
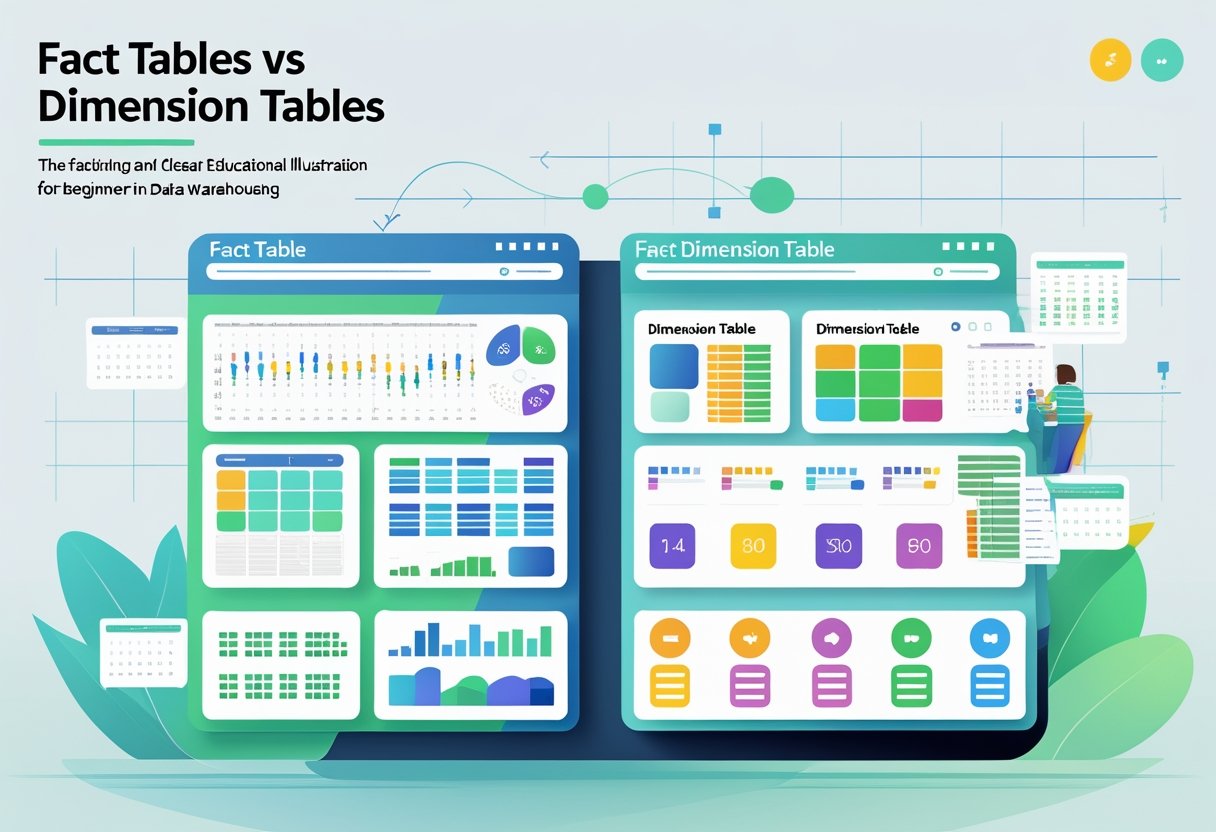
Good design principles help create fact and dimension tables that work well for business intelligence and analytics. The right grain keeps data consistent, proper keys connect tables correctly, and smart design prevents duplicate information.
Choosing the Right Grain
Grain defines the level of detail stored in a fact table. It answers what each row represents in the table.
All facts in a single fact table must be at the same grain. Mixing different detail levels creates confusion and errors in reports.
Common grain examples:
- One row per sale transaction
- One row per daily account balance
- One row per monthly inventory snapshot
Teams should pick the most detailed grain possible. This supports flexible analytics since users can roll up data but cannot drill down beyond the stored detail.
Business processes guide grain decisions. A sales process naturally creates transaction-level grain. An inventory process might use daily snapshots.
Grain affects table size and performance. More detailed grain means more rows but greater flexibility for dimensional modeling and data management.
Handling Keys and Relationships
Keys connect fact and dimension tables together. Proper key design ensures data integrity and good performance.
Dimension tables should use surrogate keys. These are simple numbers assigned in sequence, not business codes.
Benefits of surrogate keys:
- Smaller fact tables - numbers take less space than text codes
- Better performance - smaller indexes load faster
- Change tracking - new records can track dimension changes
- System independence - protects from source system changes
Fact tables resolve many-to-many relationships. Multiple products can sell in multiple stores on multiple days.
Foreign keys in fact tables should never be null. Every measurement needs complete context through valid dimension references.
Date dimensions use meaningful keys. A date like 2025-07-28 can use the key 20250728 instead of a sequence number.
Avoiding Data Redundancy
Data redundancy means storing the same information multiple times. Smart design reduces redundancy while keeping tables easy to use.
Dimension tables resolve many-to-one relationships. Product categories, store regions, and customer segments belong in dimension tables, not fact tables.
Dimension tables should be denormalized. This means flattening hierarchies into single tables instead of breaking them apart.
A product dimension might include:
- Product name
- Category name
- Department name
- Brand name
This creates some redundancy but improves query performance for business intelligence tools.
Store descriptive labels in dimension tables. Report labels and filter values belong with dimensions, not facts.
Fact tables stay lean by storing only keys and measures. This reduces redundancy and keeps fact tables focused on measurements.
Conformed dimensions reduce redundancy across the data warehouse. The same customer dimension can support sales, service, and marketing fact tables.
Practical Applications and Examples
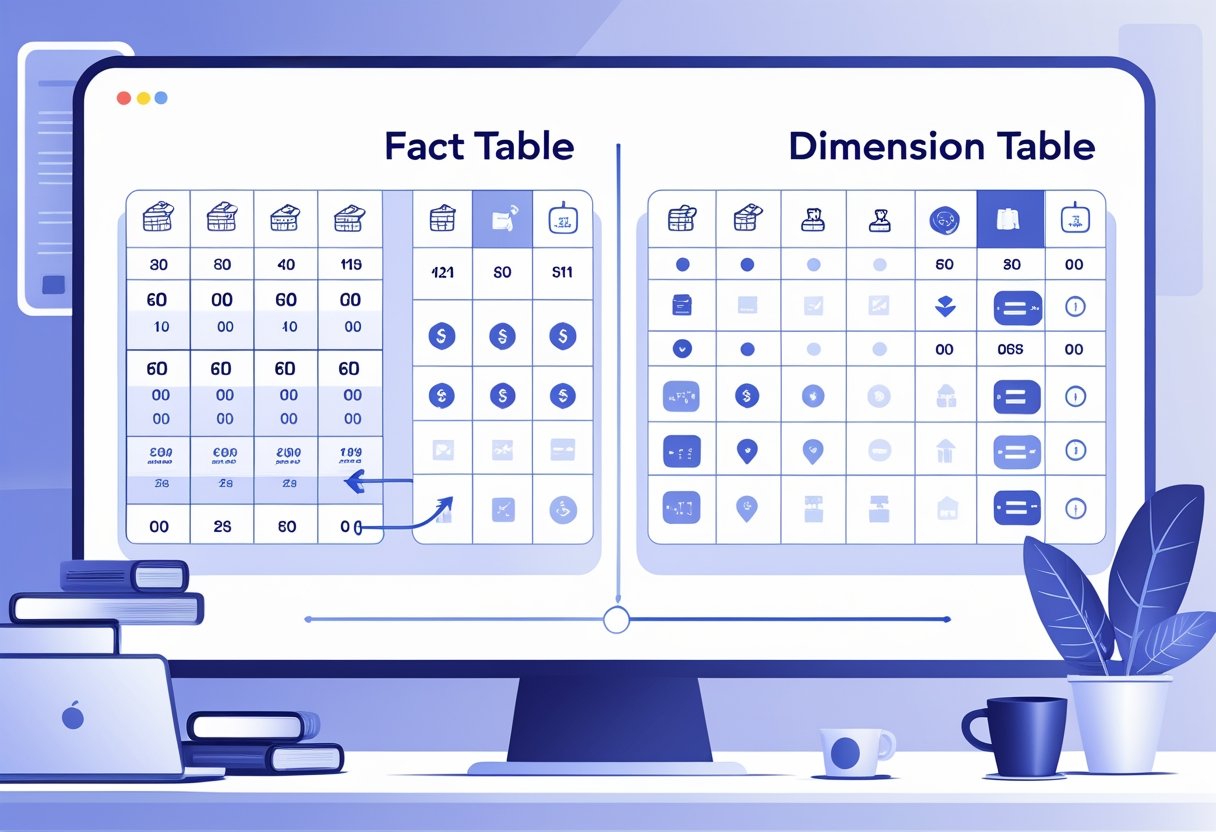
Fact and dimension tables work together in real business scenarios to store sales data, customer orders, and product information. These tables enable fast queries and support better decision making through organized data analysis.
Common Fact Table Metrics
Fact tables store quantitative data that businesses measure regularly. Sales fact tables contain metrics like order totals, item quantities, and profit margins from customer orders.
Common metrics include:
- Count of items sold
- Average order value
- Min and max purchase amounts
- Revenue totals
- Discount amounts
A sales fact table might record each transaction with values like $150 order total, 3 items purchased, and $15 discount applied. Fact tables capture measurements or metrics that answer questions about business performance.
These numbers become meaningful when combined with dimension tables. The quantitative data tells you what happened, but dimensions explain the context around those events.
Dimension Table Examples
Dimension tables provide context through descriptive details about customers, products, and time periods. A customer dimension stores names, addresses, age groups, and buying preferences for each customer.
Key dimension types include:
- Product dimension: Names, categories, prices, descriptions
- Date dimension: Years, months, quarters, weekdays
- Customer dimension: Demographics, contact details, segments
- Location dimension: Store addresses, regions, countries
Dimension tables hold descriptive attributes that give meaning to fact table numbers. A product dimension might list "Wireless Headphones" with category "Electronics" and price "$99."
Customer information in dimension tables includes details like "Premium Customer" status or "Electronics Enthusiast" preferences. This context helps analysts understand buying patterns and customer behavior.
Impact on Query Performance and Analysis
Well-designed fact and dimension tables speed up data analysis and improve decision making. Fact and dimension tables reduce core table size without losing information that can be accessed when needed.
Analysts can quickly find answers like "average order value by customer type" or "total sales by product category." The separate table structure makes these complex queries run faster.
Businesses use this setup to track customer orders across different time periods. Managers can compare monthly sales, identify top customers, and spot trends in product demand.
The organized structure supports better reporting and dashboards. Sales teams access real-time metrics while marketing teams analyze customer segments for targeted campaigns.
Frequently Asked Questions
Data professionals often have specific questions about how fact and dimension tables work in practice. These common concerns focus on their basic differences, real-world examples, interaction patterns, key structures, and the various types used in business intelligence systems.
What is the difference between fact and dimension tables?
Fact tables contain quantitative data that measures business events like sales amounts, order quantities, or revenue figures. They store the numerical values that businesses analyze to make decisions.
Dimension tables provide descriptive context with details like product names, customer information, or location data. They answer the who, what, where, and when questions about the numbers in fact tables.
Fact tables typically have fewer columns but many rows of data. Dimension tables have more columns with descriptive details but fewer total rows.
The main purpose differs between the two table types. Fact tables focus on storing measurable data for analysis while dimension tables organize and categorize that data.
Can you provide an example of both fact and dimension tables?
A sales fact table would contain columns like order ID, product ID, customer ID, sale amount, and quantity sold. Each row represents one specific sales transaction with numerical values.
The corresponding product dimension table would include product ID, product name, category, brand, color, and size. This table provides detailed information about each product referenced in the sales fact table.
A customer dimension table would contain customer ID, name, address, phone number, and registration date. The Product ID serves as a primary key, linking the two tables together.
The fact table uses foreign keys to connect with multiple dimension tables. This structure allows analysts to examine sales data from different perspectives like product performance or customer behavior.
How do fact and dimension tables interact within a data warehouse?
Fact and dimension tables work together through a star schema design. The fact table sits in the center with dimension tables surrounding it like points of a star.
Rows in fact tables include foreign keys to rows in dimension tables that represent the dimensions for each fact. These keys create the connections between numerical data and descriptive information.
When users query the data warehouse, they can combine information from both table types. They might ask for total sales by product category or revenue by geographic region.
The dimension tables filter and group the fact table data during analysis. Users can drill down from high-level summaries to detailed transaction information using these relationships.
What are the characteristics of a fact table in comparison to a dimension table?
Fact tables have fewer attributes and more records compared to dimension tables. They grow vertically as new transactions occur in the business.
Dimension tables contain more attributes but fewer records overall. They grow horizontally when new descriptive fields are added to provide more context.
Data records within fact tables do not have null values since they represent actual business events. Dimension tables may contain some null values in optional descriptive fields.
Fact tables focus on numerical measurements that can be summed or averaged. Dimension tables store text and categorical data that cannot be mathematically aggregated.
How are keys used in fact tables and dimension tables?
Fact tables use foreign keys to reference the primary keys of dimension tables. These foreign keys create the relationships that connect numerical data with descriptive information.
Dimension tables contain primary keys and surrogate keys . The primary key provides unique identification for each row while surrogate keys are system-generated identifiers.
Fact tables may also include composite keys made from multiple foreign keys. These concatenated keys help identify specific combinations of dimensions for each measurement.
The key structure enables efficient joins between tables during queries. Database systems use these relationships to quickly combine data from multiple tables for analysis.
What are the different types of fact tables commonly used in BI?
Transaction fact tables capture individual business events as they happen like individual sales or orders. They provide the most detailed level of data for analysis.
Periodic snapshot tables store aggregated data at predefined intervals such as daily or monthly summaries. These tables help analyze trends over time without processing individual transactions.
Accumulating snapshot tables track the progress of processes through different stages like order fulfillment or project milestones. They show how entities move through workflows.
Factless fact tables lack numerical measures but capture relationships between dimensions. They track events or associations that are important for business analysis.
Primary sources and further reading
The implementation details and product behavior in this guide were checked against these primary references:
- Fact Tables — Kimball Group
- Dimension Surrogate Keys — Kimball Group
- Fact Tables and Dimension Tables — Kimball Group
- Fundamentals
Natural Key vs Surrogate Key: Definitions, Examples, and When to Use Each
Learn the differences between surrogate and natural keys in databases. This guide covers their benefits, drawbacks, and when to use each type effectively.
- Data Modeling
Data Warehouse Schema Design: Star Schema to Galaxy
A hands-on walkthrough of data warehouse schema design. Model a star schema for orders, decide when to snowflake, and scale to a galaxy with multiple fact tables—plus SQL/dbt examples.
- Data Modeling
Data Modeling Basics: Star Schema vs. Snowflake Schema Explained
Learn the differences between star and snowflake schemas in data modeling. Discover how each affects query performance, storage, and maintenance.